Dashboard analytics (Workflows)
The admin dashboard includes workflow analytics.
Where to find workflow analytics
In the admin dashboard, open the Workflows tab.
Access to dashboard views can be permission-gated by your organization.
If you don’t see data
If the dashboard looks empty or shows no workflow analytics:
- Confirm you have access to the dashboard (your org may require a specific permission).
- If your environment has no workflow runs yet, charts and tables may legitimately be empty.
- Some sections may load lazily; try re-opening the tab.
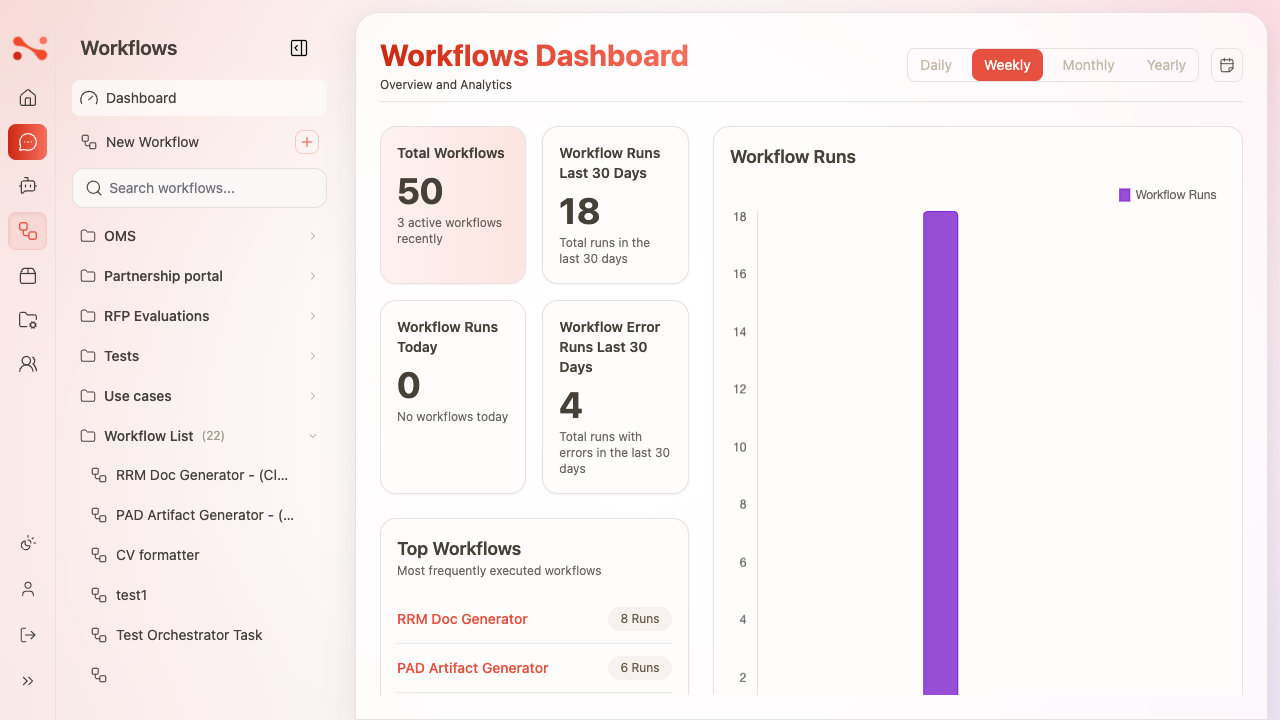
What you can see
KPI cards
Common KPIs include:
- Total workflows
- Workflow runs (last 30 days)
- Workflow runs (today)
- Workflow error runs (last 30 days)
Top workflows
The dashboard can highlight your most-run workflows.
Use this to:
- identify your highest value workflows
- spot unexpected usage spikes
Workflow runs chart
A chart shows workflow run volume over time.
Recent workflow runs table
A table view shows recent runs and supporting details like:
- Workflow name
- First input (summary)
- User
- Total token usage
- Trace/error counts
- Start time
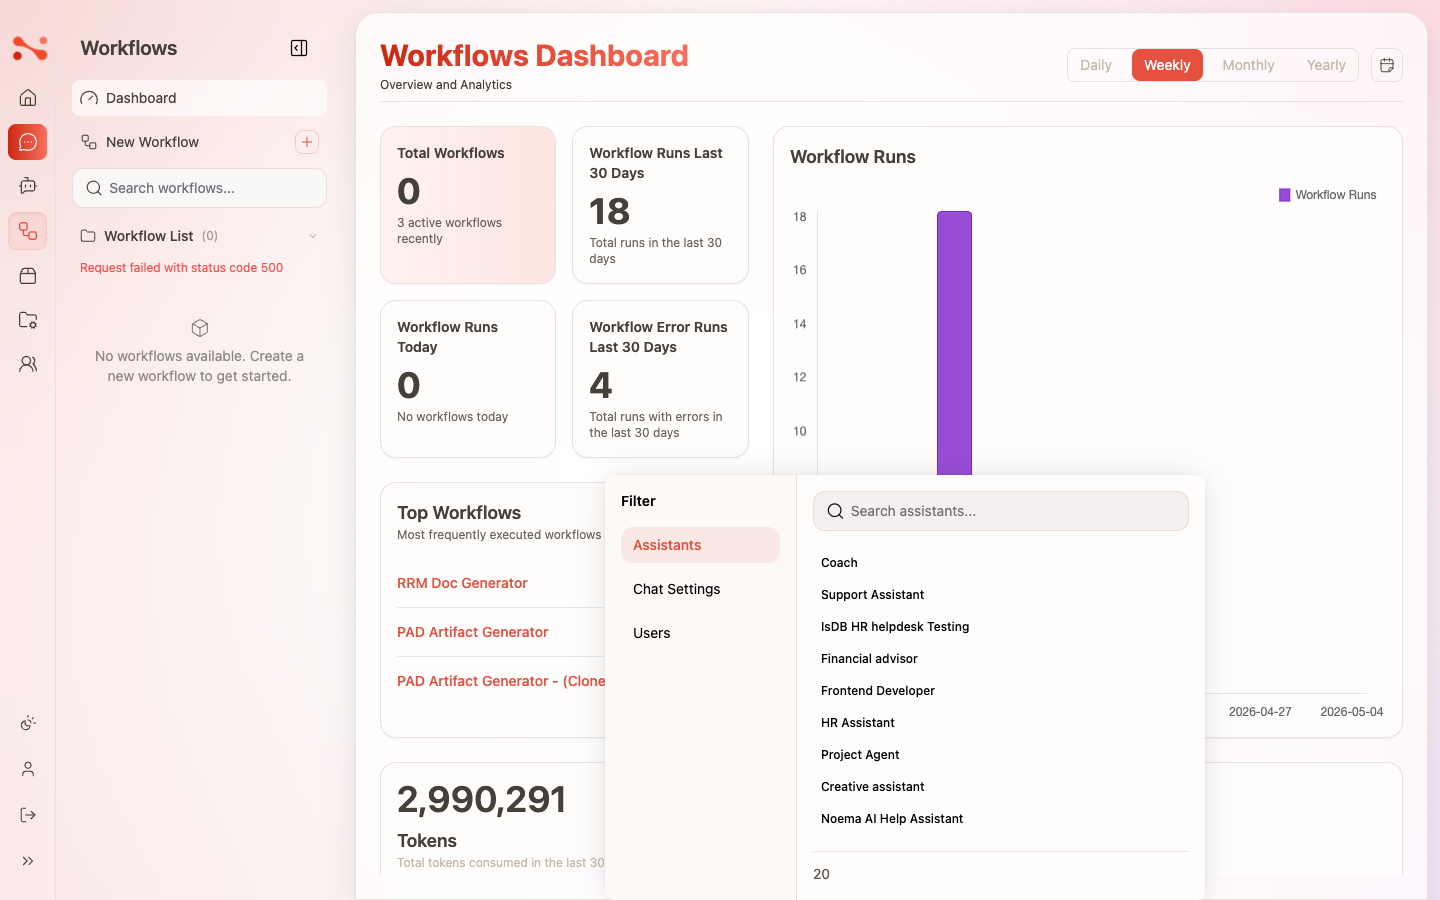
Filtering workflow analytics
The workflow runs table supports filtering, including:
- by workflow
- by user
- by date range
- sorting (where available)
How to use analytics effectively
- Watch for increases in error runs; use run details to find the failing task.
- Use “Top workflows” to prioritize improvement and prompt tuning.
- Filter by user when investigating a specific incident or workflow change.