Sources Dashboard
The Sources Dashboard is the analytics hub for document ingestion monitoring. It gives admins visibility into how many documents have been processed, token consumption, ingestion failures, and recent activity.
URL: /sources/dashboard
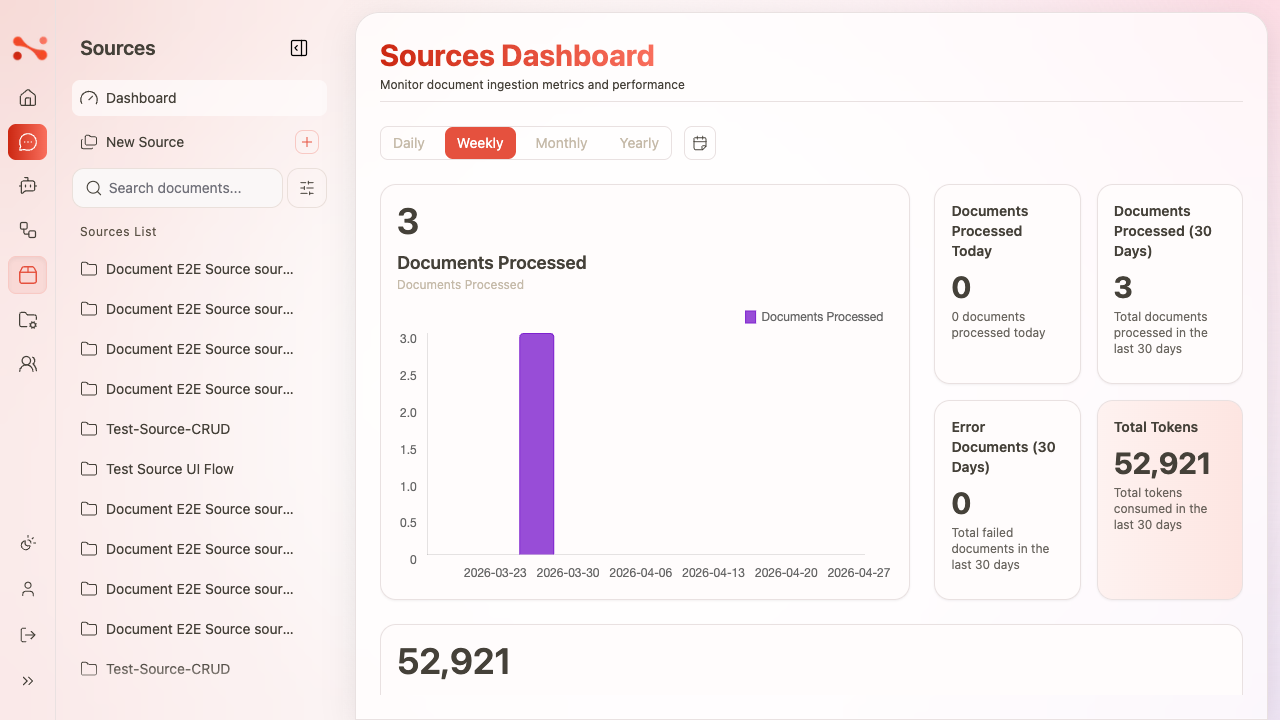
Heading: "Sources Dashboard"
Subtitle: "Monitor document ingestion metrics and performance"
Section 1 — Charts
Time period tabs
A Chart Time Period tab group with four options: Daily | Weekly | Monthly | Yearly
- Default selected: Weekly
- Switching tabs updates the chart values
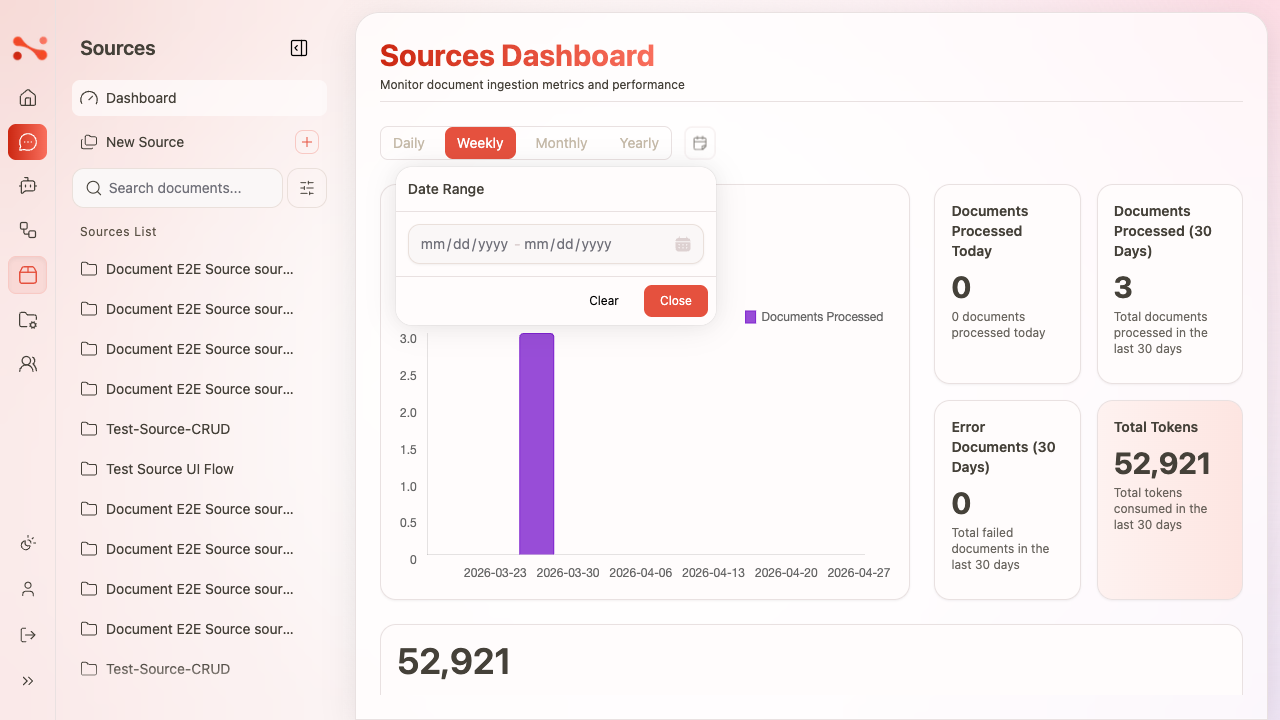
A date range picker button sits to the right of the tabs — opens a calendar dialog to select a custom range (mm/dd/yyyy – mm/dd/yyyy).
Charts
| Chart | What it shows |
|---|---|
| Documents Processed | Count of documents processed in the selected time period |
| Tokens | Total tokens consumed |
Charts update when you switch time period tabs.
Section 2 — Stat cards
Four fixed stat cards always show 30-day rolling metrics — they do not change when you switch time period tabs.
| Card | Description |
|---|---|
| Documents Processed Today | Count of documents processed in the current day |
| Documents Processed (30 Days) | Total documents processed in the last 30 days |
| Error Documents (30 Days) | Total failed documents in the last 30 days |
| Total Tokens | Total tokens consumed in the last 30 days |
Stat cards are always 30-day figures regardless of which time period tab is selected. Only the charts respond to tab changes.
Section 3 — Document Processing Queue

Shows documents that are currently waiting to be processed or have failed ingestion.
Queue filter tabs
| Tab | Shows |
|---|---|
| Failed N | Documents that failed ingestion |
| Waiting N | Documents currently queued for processing |
When a tab has zero items, an empty state is shown:
- Failed = 0: "No failed documents"
- Waiting = 0: "No documents waiting for processing"
Failed documents table
| Column | Description |
|---|---|
| Document ID | UUID — links to /sources/{sourceCode}/{documentId} |
| Source | Source code — links to /sources/{sourceCode} |
| Last Update | Date/time of last processing attempt |
| Attempts | Number of failed ingestion attempts |
| Actions | Retry button (icon) |
Clicking Retry immediately moves the document from the Failed table to the Waiting table. The Failed counter decrements and the Waiting counter increments in real-time without a page refresh.
See Ingestion Queue for the full Retry flow.
Document Process donut chart
Shows the ratio of Waiting (orange) to Failed (red) documents. A Refresh button reloads the queue data.
Section 4 — Recent Ingestion Sessions
Shows the ~10 most recent document ingestion events across all sources, sorted most-recent-first.
| Column | Description |
|---|---|
| Document | Filename or UUID — links to the document detail page |
| Source | Source code — links to the source detail page |
| User | Full name of the user who triggered ingestion |
| Tokens | Token count consumed |
| Start Time | Date/time the ingestion session started |
Business rules
| Rule | Behaviour |
|---|---|
| Stat cards are 30-day fixed | Not affected by time period tab selection |
| Charts respond to tab | Daily/Weekly/Monthly/Yearly change chart values |
| Date range picker | Custom range selection updates chart values |
| Queue tabs filter by status | Failed / Waiting shown separately |
| Empty states | "No failed documents" / "No documents waiting for processing" |
| Retry is real-time | No page refresh needed — counters update immediately |
| Recent sessions linked | Document and Source links navigate to detail pages |